“How do I better understand how a flood will behave and what the implications may be?”
Thematic flood surfaces
A library of design flood surfaces at your fingertips. Readily interrogate the model at any location.
Interactive animations
Animate, pause, step through, zoom and interrogate your modelling results.
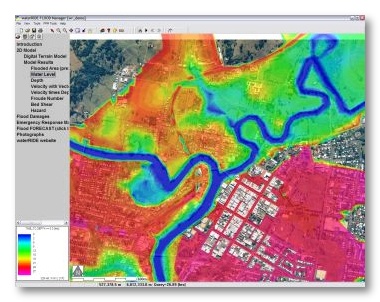
Common interface
Regardless of the model you use, interrogate any of your model results with the convenience of a single interface.
Plot parameter data
Create time series, profile, and flow plots at any location.
waterRIDE provides floodplain managers with rapid, yet sophisticated access to their time-varying model results along with a range of purpose-built floodplain management tools.
Successful floodplain management and planning requires a thorough understanding of local flood behavior.
Conventional GIS provides access to static “snapshots” of model results (often at the peak) in a limited, generic framework. Floods are inherently dynamic and ignoring that fact means you lose much of your understanding of the flood and its behavior such as: isolation and subsequent inundation, rates of rise, time to inundation, time available for evacuation, and duration of inundation. One also must be aware of derived parameters such as velocity times depth and flood hazard, as peak depth does not necessarily occur at the same time as peak velocity!
waterRIDE works with all flood model outputs, so it does not matter what type of model was used in your flood studies.
More Benefits
- Share flooding data
Share flooding information across the organisation in a quality controlled, view-only manner using waterRIDE FLOOD Viewer. Different waterRIDE projects can be setup to convey datasets in targeted ways for different end user types. - GIS backdrop
Enhance your understanding of the model results using rich and familiar GIS datasets as backdrops. - Flood Extents
Rapidly generate GIS flood extents for ready identification of flood affected properties. Export to any GIS package with sophisticated smoothing options. - Rate of rise
Display rates of rise at any location in the model to improve understanding of the time varying nature of your flooding issues - Floodway, flood storage, flood fringe
Boolean logic queries allow you to identify zones where velocity and depth meet certain criteria to assist with definition of floodways, flood storage areas and the flood fringe. - GIS integration
Easily populate GIS layers with data from your model results (such as peak flood levels and flood hazard). Or, use your GIS data in conjunction with the model results to calculate values such as depth of over floor flooding, or depth over evacuation routes. - Peak of peaks
Easily calculate the peak flood envelope (water level, extent, velocities, VxD, hazard, etc.) from a series of model results. For example, different 100-year rainfall intensities and durations, or overlapping studies. - Handle any type of flood modelling
Storm surge, riverine, overland flow or piped. - Flood planning level
Automatically add a buffer to peak flood levels to derive a flood planning surface, readily showing those properties within the flood planning zone and the required minimum floor levels. - Parameter queries
Query your model results for specific hydraulic criteria for identification of dangerous flooding conditions. - Flood damages
Easily calculate flood damages across all flood events, for all properties in the catchment, including calculation of Average Annual Damage (AAD) and net present value analysis. Easily carry out cost-benefit analysis of various floodplain management options. - Metadata
Tag all of your model results with additional information (such as source report, results date, comments, etc.) for quality assurance purposes. - Quality assurance
Free up your time with rapid and consistent issuing of flood information, including automated flood certificates. - Evacuation planning
Interactive animation of your model results in a live GIS environment allow you to visualize and interrogate how floods develop providing essential information in evacuation phasing and planning. - Flood forecasting
Rapidly interpolate a predicted peak flood surface from a predicted level at a gauge (or multiple gauges). See what a predicted flood will look like and use the predicted surface for planning and management. - Property photos
Integrate flood levels with scaled property photos to provide a realistic representation of flooding at an individual property and greatly enhance community flood awareness and understanding - Difference mapping
Clearly view the impact of proposed developments, flood mitigation options or climate change scenarios through difference mapping. The surfaces do not even need to be on the same framework, you could for instance prepare a difference surface between the new 2D model results and the old 1D model results! - Multi-criteria property tagging
Rapidly identify and tag properties as flood affected. - Automated flood certificates
Ensure fast, consistent, and quality controlled flood information is issued at the click of a button. - Surface interpolation/extrapolation
Easily create flood surfaces by interpolating or extrapolating from existing model results. For example, create an indicative 50-year flood from the 20-year and 100-year floods, or generate a surface representing 10.2m at the gauge.