Overview
The approach taken by waterRIDE™ in flood forecasting focuses on leveraging readily available data (hydraulic modelling results, digital elevation models, property GIS datasets, critical infrastructure GIS datasets etc) to provide an indication of likely flood behaviour and, often more importantly, the consequences (or affectation) of such flooding on the community and emergency management efforts.
For example, a 2D gridded model with a 10m cell size would provide an indication of flooding down to a 10m by 10m square resolution. Whilst this may be suitable for the description of flood behaviour on a regional level, when you are looking to determine the maximum depth on an urban land parcel, the 10m resolution is unlikely to be adequate. Perhaps, a 2m cell size would be more suitable?
Along similar lines, in 1D models, outputs are only reported at discrete locations (usually cross sections or nodes) in the floodplain, which exacerbates the problem encountered with our 2D model example.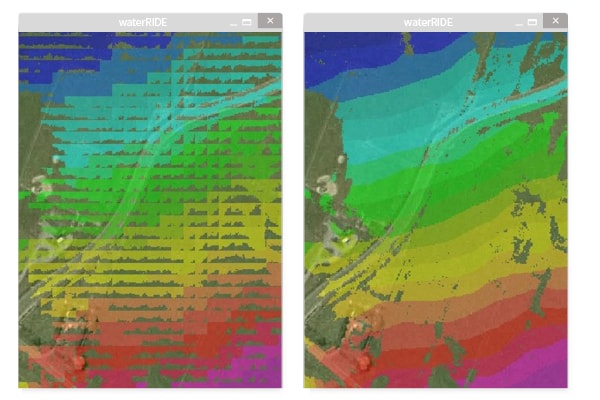
By mapping model results to a new framework (usually, a finer scale terrain framework (DEM)), you are able to enhance the interpretation of the model results, especially with any parameters associated with depth (eg flood extents, velocity x depth, hazard etc).
The presumption behind this approach is that the framework on which the model was built adequately describes the hydraulics of the floodplain, and that by mapping we are only enhancing the interpretation of flood depth (and associated parameters). If this is the case, then by mapping, we are effectively enhancing the quality of the outputs without the need to endlessly increase the resolution of the modelling.
waterRIDE™ provides a wealth of specialised tools to ensure you get quality outcomes when mapping your model results, allowing you to overcome “issues” such as:
- “glass walls” (in both 1D and 2D models)
- Flat water surfaces across discrete elements in a model (eg gridded finite difference models or finite volume models)
- Significant changes in framework resolutions
- Surface smoothing prior to and during mapping
- Mapping areas of shallow flow
- Merging areas of overlapping model results (eg different catchments or ocean and river flooding)
- Obtaining the “peak of peaks” for multiple model runs (eg 100yr storm with 1hr, 2hr, 6hr duration storms etc)
Depth-based hydraulic parameters (eg flood extent, hazard, VxD etc) are enhanced by mapped to a finer scale terrain framework (or DEM).
The example to the left shows a 20m model grid that has been mapped to a 2m LiDAR based DEM.
Notice the significant increase in detail of the flood extent.

20M Model Grid

Mapped to 2m DEM
Overcome “Glass Walls”
Automated stretching routines allow “glass walls” to handled.
It does not matter whether the “glass walls” were introduced by the modelling or through the mapping to the finer scale DEM process.

Cross Section Showing ‘Glass Wall’

Cross Section After Stretching
Mapping Coarse Model Grids to Much Finer DEM’s
(Part 1 – Create TIN Prior to Mapping)
Overcome the limitations of grid models and their “flat, terraced” water surfaces by creating a continuous surface through triangulation (creating a TIN) prior to mapping.
This is particularly important in areas of shallow flow and where the resolution difference between the grids is substantial.

Direct Mapping Of Gridded Results

TINing Grid Results Prior To Mapping
Mapping Coarse Model Grids to Much Finer DEM’s
(Part 1 – Continued)
By TINning the gridded model results prior to mapping, the discontinuous gridded water surface (top image) is converted to a continuous surface (bottom image).
This provides a more realistic interpretation of the girdded model results, and hence, the mapped output is of higher quality.


Mapping Coarse Model Grids to Much Finer DEM’s (Part 2 – Dyanmic TINning)
If mapping is being carried out to reduce pixellation, dynamic TINning may be a quick solution.

Gridded Model Results

Dynamic TINing (surface Smoothing)
Stretching Gridded Models
In a gridded model, cells are either wet or dry. When mapping to a finer scale DEM, this can cause “glass walls” where some of the finer DEM cells would be wet underneath a dry model cell.
Notice the difference between the two mapped surfaces, with and without stretching.

Raw Model Results

Mapped to DEM Without Stretching

Mapped to DEM and Stretched
Mapping 1D Model Results
Enhance the usability of 1D model results through mapping to a fine scale DEM.
Create a 2D framework for the 1D model cross sections (or nodes) and then map to a DEM.

1D Model Results & 2D Framework

Mapped 1D Model Results
- Flood model outputs (1D or 2D)
- A terrain model (DEM), usually at a finer scale than the flood model – as either a TIN or a grid
Mapping can be readily carried out using:
- waterRIDE™ FLOOD Manager
- waterRIDE™ 1D Surface
Details on the above products can be found in the “products” pages.